K-Means Clustering in Machine Learning: Complete Guide
Up until now, our tutorials have primarily focused on supervised algorithms (like K-Nearest Neighbors and Random Forests) where the data provides explicit answers ("Yes" or "No"). But what happens when you have a massive dataset of customers with absolutely no labels or categories attached? Welcome to the powerful domain of unsupervised learning algorithms.
Today, we explore the industry-standard algorithm used to find hidden patterns in raw data: K-Means Clustering in machine learning.
1. What are Clustering Algorithms in AI?
In data mining, clustering algorithms in ai are utilized to group unlabelled data points together based strictly on their internal similarities and geometric distances. The algorithm has no predefined "target" to aim for. Instead, it natively discovers that Certain User A shares incredibly similar behavior patterns to Certain User B, grouping them permanently into a defined "Cluster".
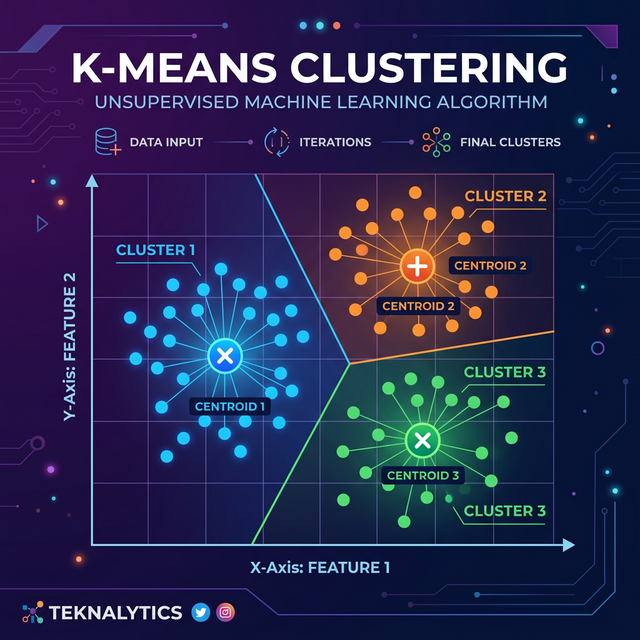
2. How K-Means Works (The Centroid Mechanics)
Understanding exactly how k-means works requires visualizing a geometric scatter plot. Here is the step-by-step mathematical logic happening behind the scenes:
- Choose K: First, you choose a number 'K'. This is the total number of distinct groups (clusters) you want the algorithm to divide the raw data into (e.g., K = 3).
- Initialize Centroids: The algorithm randomly drops 'K' number of pins, called "Centroids," directly onto the graph.
- Assign Points: The algorithm measures the mathematical Euclidean distance between every single data point and these Centroids. Each data point is permanently assigned to whichever Centroid it sits closest to.
- Move Centroids: Once all points are assigned, the algorithm naturally calculates the new "center of mass" (mean) for each cluster, and physically moves the pins to these exact center locations.
- Repeat: The points are re-measured and re-assigned based on the new pin locations. The pins move again. This elegant loop strictly repeats until the pins completely stop moving (convergence).
3. The mathematical "Elbow Method" K Means Trick
The biggest dilemma data scientists face with K-Means is answering: "How do I know what number to choose for 'K'?" If you choose K=2, it might be too broad. If you choose K=20, it becomes completely unreadable.
The solution is the renowned elbow method k means optimization trick. You run the algorithm multiple times in a loop, from K=1 to K=10, calculating the Within-Cluster Sum of Squares (WCSS). WCSS measures how "tight" and packed the clusters are. As you increase 'K', the WCSS naturally drops.
When you plot the WCSS values on a line graph, you'll see a sharp drop that suddenly flattens out, forming an "Elbow". The exact point where the graph visually bends—the elbow—is mathematically considered the absolute optimal 'K' value for your specific dataset.
4. Practical K-Means Python Example
Let's simulate a mall trying to segment its customers based purely on Annual Income and Spending
Score (1-100) using the official KMeans documentation from
scikit-learn.
# 1. Import vital libraries

import numpy as np

import matplotlib.pyplot as plt

from sklearn.cluster import KMeans


# 2. Dummy Customer Data: [Annual Income ($k), Spending Score (1-100)]

# (Notice there are NO labels/answers 'y')

X = np.array([[15, 39], [16, 81], [15, 6], [17, 77], [18, 9], [60, 40], [62, 45], [63, 50], [90, 80], [100, 95], [85, 75]])


# 3. Applying the Elbow Method to find the best 'K'

wcss = []

for i in range(1, 6): # Testing K from 1 to 5

    kmeans = KMeans(n_clusters=i, init='k-means++', random_state=42, n_init=10)

    kmeans.fit(X)

    wcss.append(kmeans.inertia_) # Inertia represents the WCSS


# (At this point, you would visually plot the WCSS 'elbow' graph)


# 4. We assume the optimal K was visually determined to be K=3

optimal_kmeans = KMeans(n_clusters=3, init='k-means++', random_state=42, n_init=10)


# 5. Fit the model and predict the cluster label for each data point

cluster_labels = optimal_kmeans.fit_predict(X)


# 6. View the assigned Clusters

print("Customer Assigned Clusters (Group 0, 1, or 2):")

print(cluster_labels)

print("\nThe geometric coordinates of the final Centroids:")

print(optimal_kmeans.cluster_centers_)
Conclusion
Mastering k means clustering machine learning logic opens the doorway to highly sophisticated unsupervised data analytics. From customer segmentation in mega-retailers, to document topic clustering, to isolating fraud patterns in a sea of bank transactions, you can reliably expect K-Means to find geometric structures human eyes could never process.
Discussion